
A personal detour — where this started
Back in 2014 I wrote my EngD thesis at TU/e on exactly this problem: Customer profiles: extracting usage models from log files. The idea was to take raw application log files and automatically reconstruct how users actually used a system — not how the spec said they should, but the real execution paths, the shortcuts, the error recoveries, the outliers.
The pipeline I built then had all the same moving parts: a data source, an event parser, an enricher to attach business context, a combiner to group events into cases, and finally a miner. I tested the heuristics miner and the genetic miner. They worked, but the tooling was rough. One of the main conclusions was that process mining lacked sufficient maturity for industrial use — the algorithms were sound but the infrastructure around them was not.
Twelve years later the infrastructure caught up.
What is process mining?
Process mining sits at the intersection of data mining and process modeling. The input is an event log: a table of events where each row has at minimum three things — a case ID (which process instance this event belongs to), an activity name (what happened), and a timestamp (when it happened). From that, three families of analysis become possible:
Discovery reconstructs a process model — a Petri net, BPMN diagram, or directly-follows graph — purely from observed behavior. No one draws the model; the algorithm induces it from data.
Conformance checking takes a model (discovered or hand-drawn) and measures how well the recorded cases fit it. Token replay walks each trace through the net and counts where tokens get stuck or need to be created from nowhere. A fitness score of 1.0 means every case followed the model exactly. Anything less tells you where and how reality diverged.
Performance analysis decorates the model with timing data — how long each activity takes, where cases queue, which paths are slow. Unlike a dashboard that shows aggregate throughput, process mining shows the distribution per activity per path, so a slow tail on one branch does not get averaged away by a fast majority on another.
The technique originated in academic research at TU/e in the late 1990s under Wil van der Aalst, and is now widely used in ERP audit, healthcare pathway analysis, and manufacturing. The open-source library pm4py brings all of it to Python in a few lines of code.
The insight that connects observability to process mining
OpenTelemetry spans are an event log hiding in plain sight. Every span has a name, a start time, an end time, and business attributes. That is exactly the raw material process mining needs.
In this article, I want to show you how I added a process mining layer to an IoT alarm analysis pipeline built on Durable Functions, Azure OpenAI, and RAG — and what it reveals that traditional observability cannot.
The workflow
The system processes telemetry from IoT sensors. When a reading crosses a threshold, an alarm fires and triggers a multi-step Durable Functions orchestration:
- Fetch recent telemetry (last 10 minutes)
- Fetch device context
- Search for similar past alarms via pgvector (RAG)
- Call Azure OpenAI GPT-4.1 with all that context
- Validate the result
- Fan out: write to PostgreSQL, store an embedding, notify, create a maintenance ticket
The workflow is well-defined on paper. Whether it executes that way in practice is a different question. Process mining answers it automatically, without writing bespoke queries.
Extending the Aspire project
The process mining service slots into the existing Aspire AppHost as a plain container resource built from a local Dockerfile:
var processMining = builder.AddDockerfile("process-mining", processMiningContextPath)
    .WithEndpoint(targetPort: 8000, name: "http", scheme: "http")
    .WithBindMount(Path.Combine(builder.AppHostDirectory, "process-mining-data"), "/data")
    .WithUrlForEndpoint("http", url => url.DisplayText = "Process Mining Dashboard")
    .ExcludeFromManifest();

var pmEndpoint = processMining.GetEndpoint("http");
Aspire resolves the container’s runtime address and injects it into every .NET service as the environment variable PROCESS_MINING_OTLP_ENDPOINT. The orchestrator also declares a WaitFor(processMining) dependency so it does not start until the mining service is ready to receive traces. The SQLite database lives in a bind-mounted host directory so trace data survives service restarts during development.
The tricky part is the exporter configuration. Aspire’s standard UseOtlpExporter() is a cross-cutting call that registers exporters for all signals at once — but it cannot coexist with signal-specific AddOtlpExporter() calls on the same IServiceCollection. Since we need traces to go to two destinations (Aspire dashboard and the mining service) while metrics continue to go only to the dashboard, the ServiceDefaults extension detects whether both endpoints are present and switches strategies accordingly:
if (hasAspire && hasPm)
{
    // Can't use UseOtlpExporter() here — register signal-specific exporters instead
    builder.Services.AddOpenTelemetry()
        .WithTracing(t => t
            .AddOtlpExporter(o => o.Endpoint = new Uri(aspireEndpoint!))
            .AddOtlpExporter(o =>
            {
                o.Endpoint = new Uri($"{processMiningEndpoint}/v1/traces");
                o.Protocol = OtlpExportProtocol.HttpProtobuf;
            }))
        .WithMetrics(m => m
            .AddOtlpExporter(o => o.Endpoint = new Uri(aspireEndpoint!)));
}
If the mining service is absent (e.g. in Solution 1, or when the env var is not set), the branch falls through to the standard UseOtlpExporter() path and nothing changes for those services. No feature flags, no conditional compilation — just an environment variable check at startup.
Instrumenting the activities
Each Durable Functions activity creates a span tagged with business context. The key attribute is orchestration.instance_id — it becomes the case ID in process mining, grouping all activity spans for a single alarm analysis run into one trace:
using var activity = _activitySource.StartActivity("SearchSimilarAlarms");
activity?.SetTag("orchestration.instance_id", input.OrchestrationId);
activity?.SetTag("device.id", input.DeviceId);
activity?.SetTag("rag.similar_count", similarAlarms.Count);
Minimum data requirements
A process mining event log needs exactly three columns. Every other attribute is optional enrichment.
| Column | Source | Notes |
|---|---|---|
| Case ID | orchestration.instance_id tag |
Groups all activity spans for one alarm run into a single case. Without it the span is stored but excluded from mining. |
| Activity name | span.name |
Already on every span. Use the activity function name — SearchSimilarAlarms, CallAiAnalysis, etc. — not a generic label. |
| Timestamp | start_time_unix_nano |
Already on every span. The end time is used for duration; process ordering is derived from start time. |
The instrumentation scope is the fourth critical constraint. The mining service filters exclusively for IoT_AI_Demo.Orchestrator — spans from the HTTP layer, health checks, and Durable Functions infrastructure are accepted at the OTLP endpoint but silently discarded. If your spans arrive but never appear in the dashboard, the scope name is the first thing to check.
Everything beyond those three columns is optional but unlocks richer filtering. The span store also extracts alarm.level, alarm.value, ai.adjusted_severity, ai.available, rag.similar_count, and telemetry.count when present, so the dashboard can slice analysis by device or alarm severity without re-instrumenting later.
The mining service
A FastAPI service receives OTLP traces over HTTP protobuf, persists matching spans to SQLite, and exposes a mining API built on pm4py.
The reason I chose SQLite here is simplicity. The mining service is a sidecar to the main system — its data is ephemeral, derived from traces, and does not need to survive a full cluster restart. A single file is easy to inspect, easy to mount as a Docker volume, and easy to throw away.
What the mining reveals
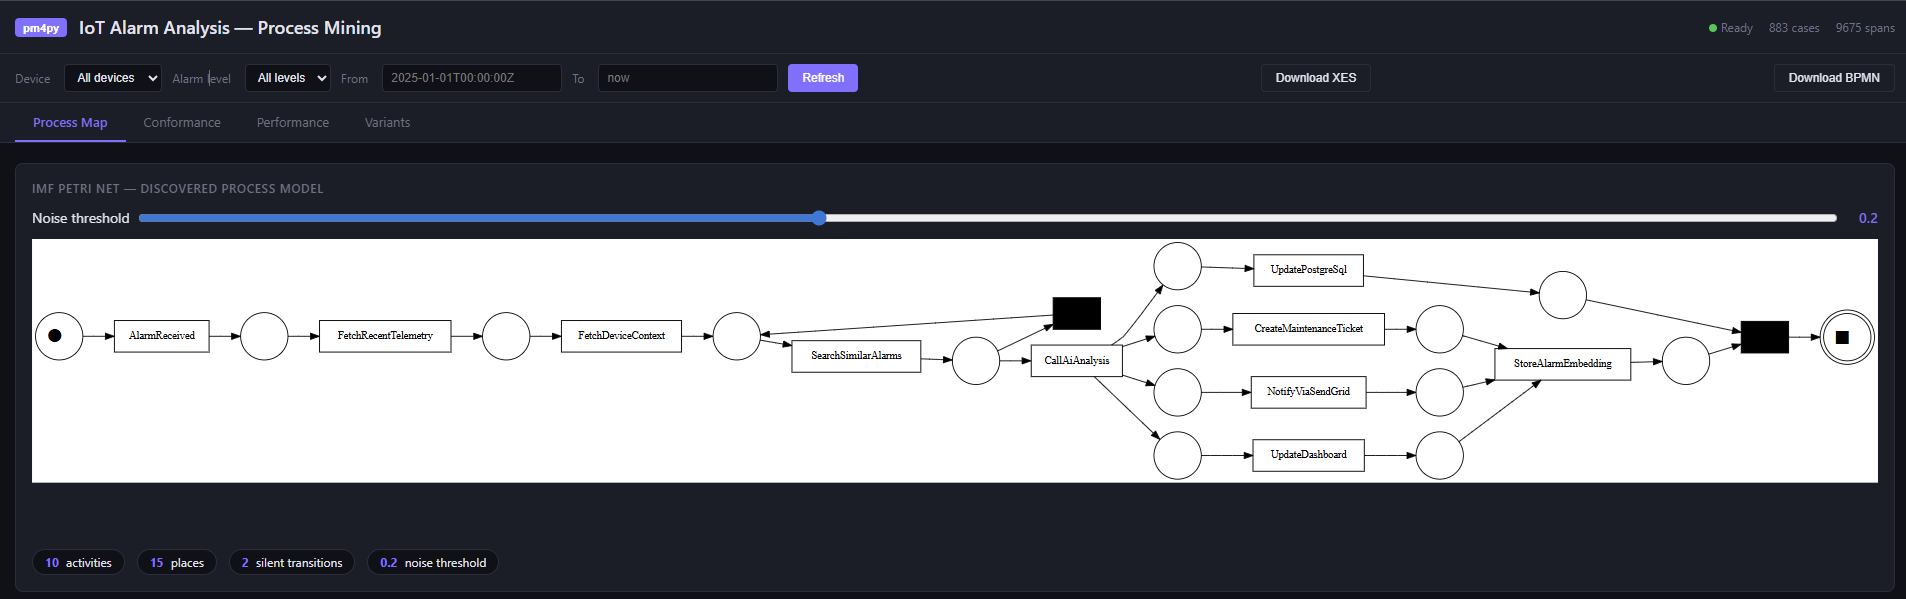
Process discovery. Using Inductive Miner with noise filtering (IMf), the service discovers a Petri net from the actual execution traces. The noise threshold — configurable in the UI — hides low-frequency paths. The discovered net is the ground truth of what your system does, not what the code says it does.
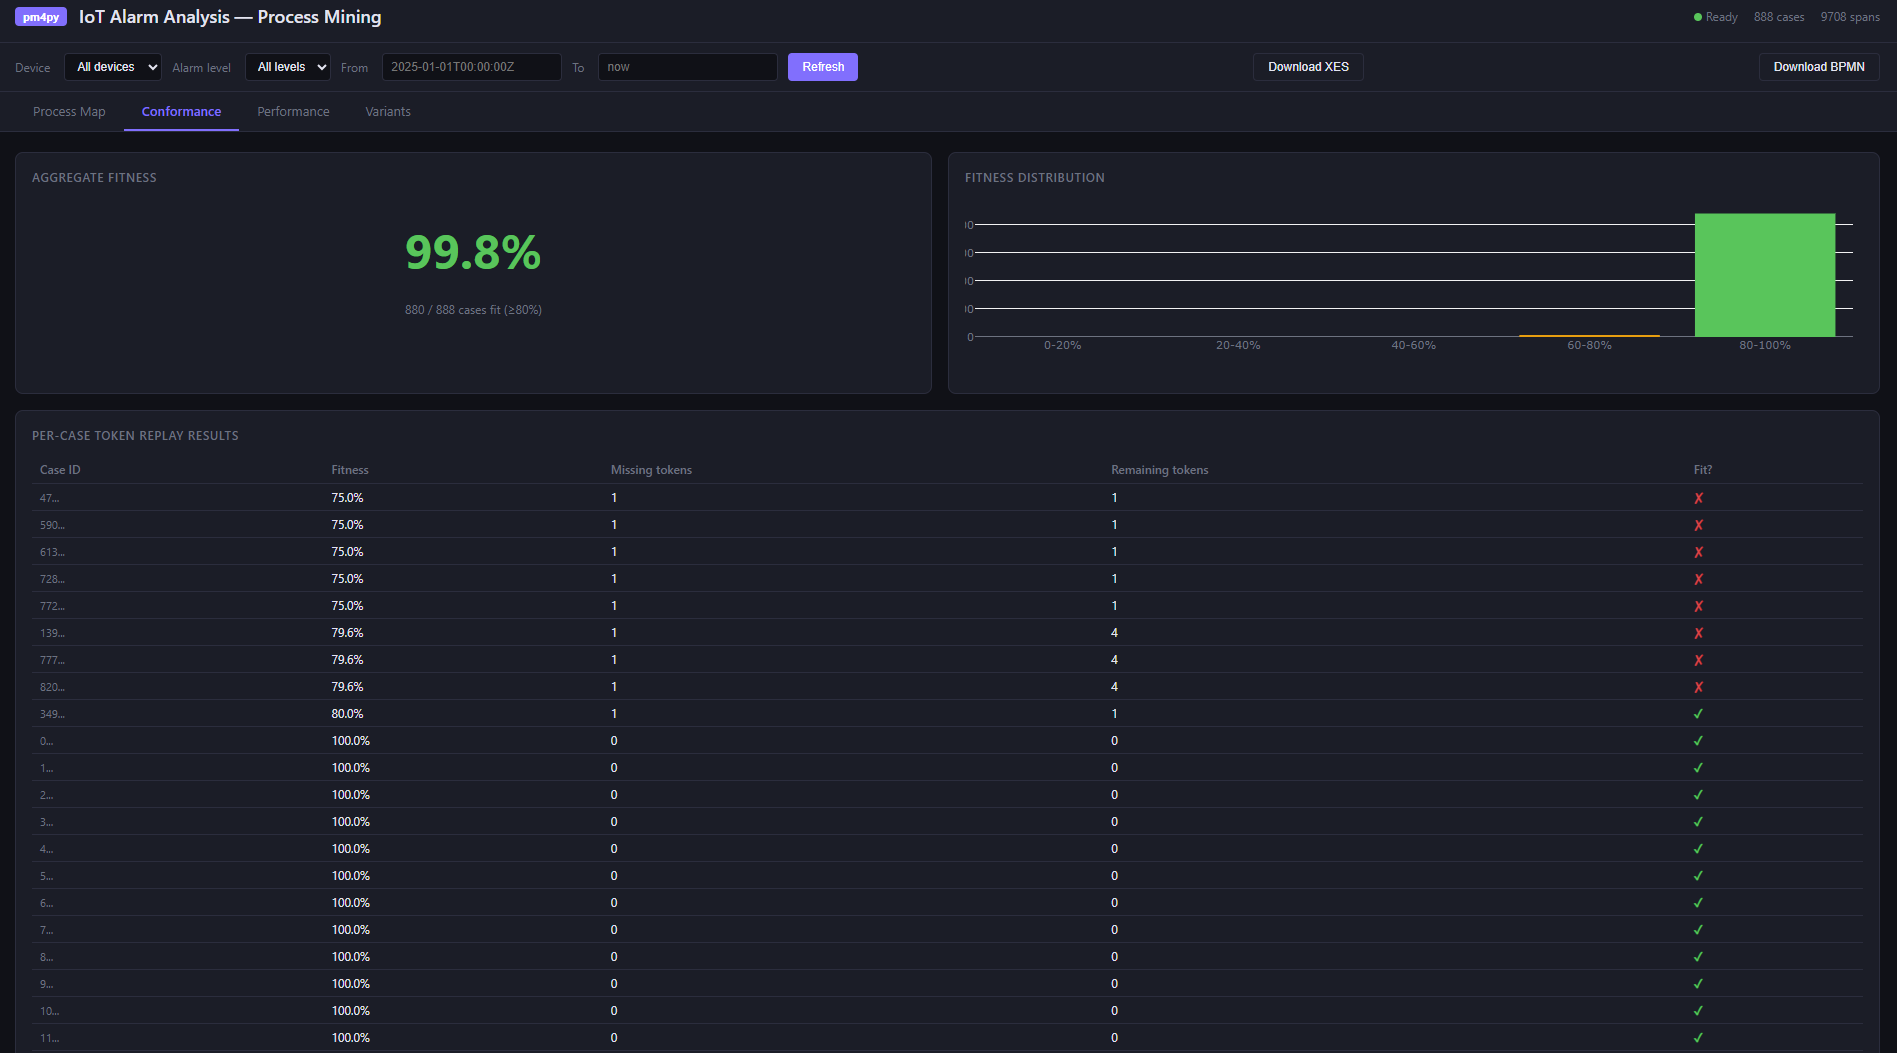
Conformance checking. Token replay replays each recorded case against the discovered model and measures fitness: how well the actual execution conforms. A fitness of 1.0 is perfect. Low-fitness cases usually have an obvious cause — an AI timeout that caused the validation step to be skipped, or a test run that exercised an error path.
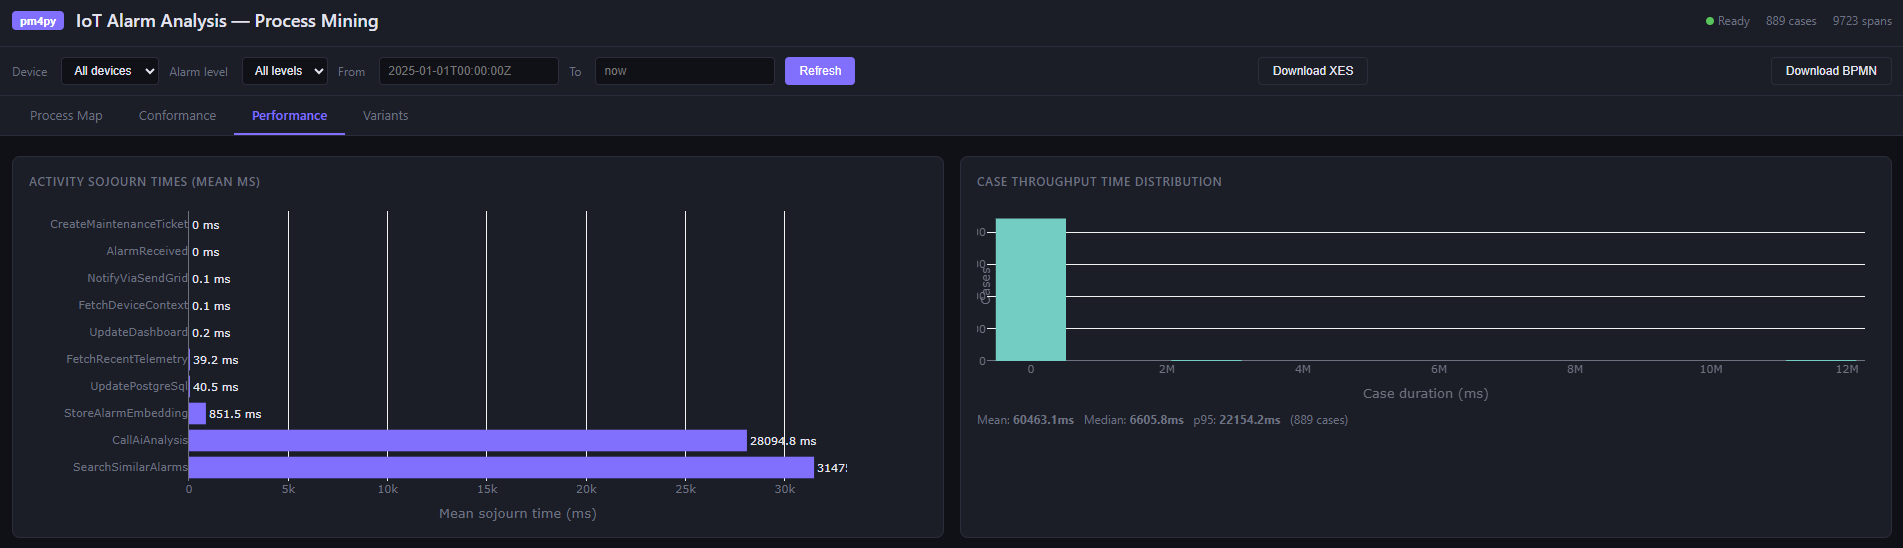
Performance analysis. This is where process mining earns its place alongside traditional monitoring. Activity sojourn times across all cases:
| Activity | Mean (ms) | Median (ms) |
|---|---|---|
| CallAiAnalysis | ~2,100 | ~1,800 |
| SearchSimilarAlarms | ~85 | ~70 |
| FetchRecentTelemetry | ~32 | ~28 |
| FetchDeviceContext | ~18 | ~15 |
The AI call dominates — expected. But a high p95 on SearchSimilarAlarms would indicate pgvector index pressure under load that the mean hides. While the traditional dashboards show aggregates, process mining shows the distribution.
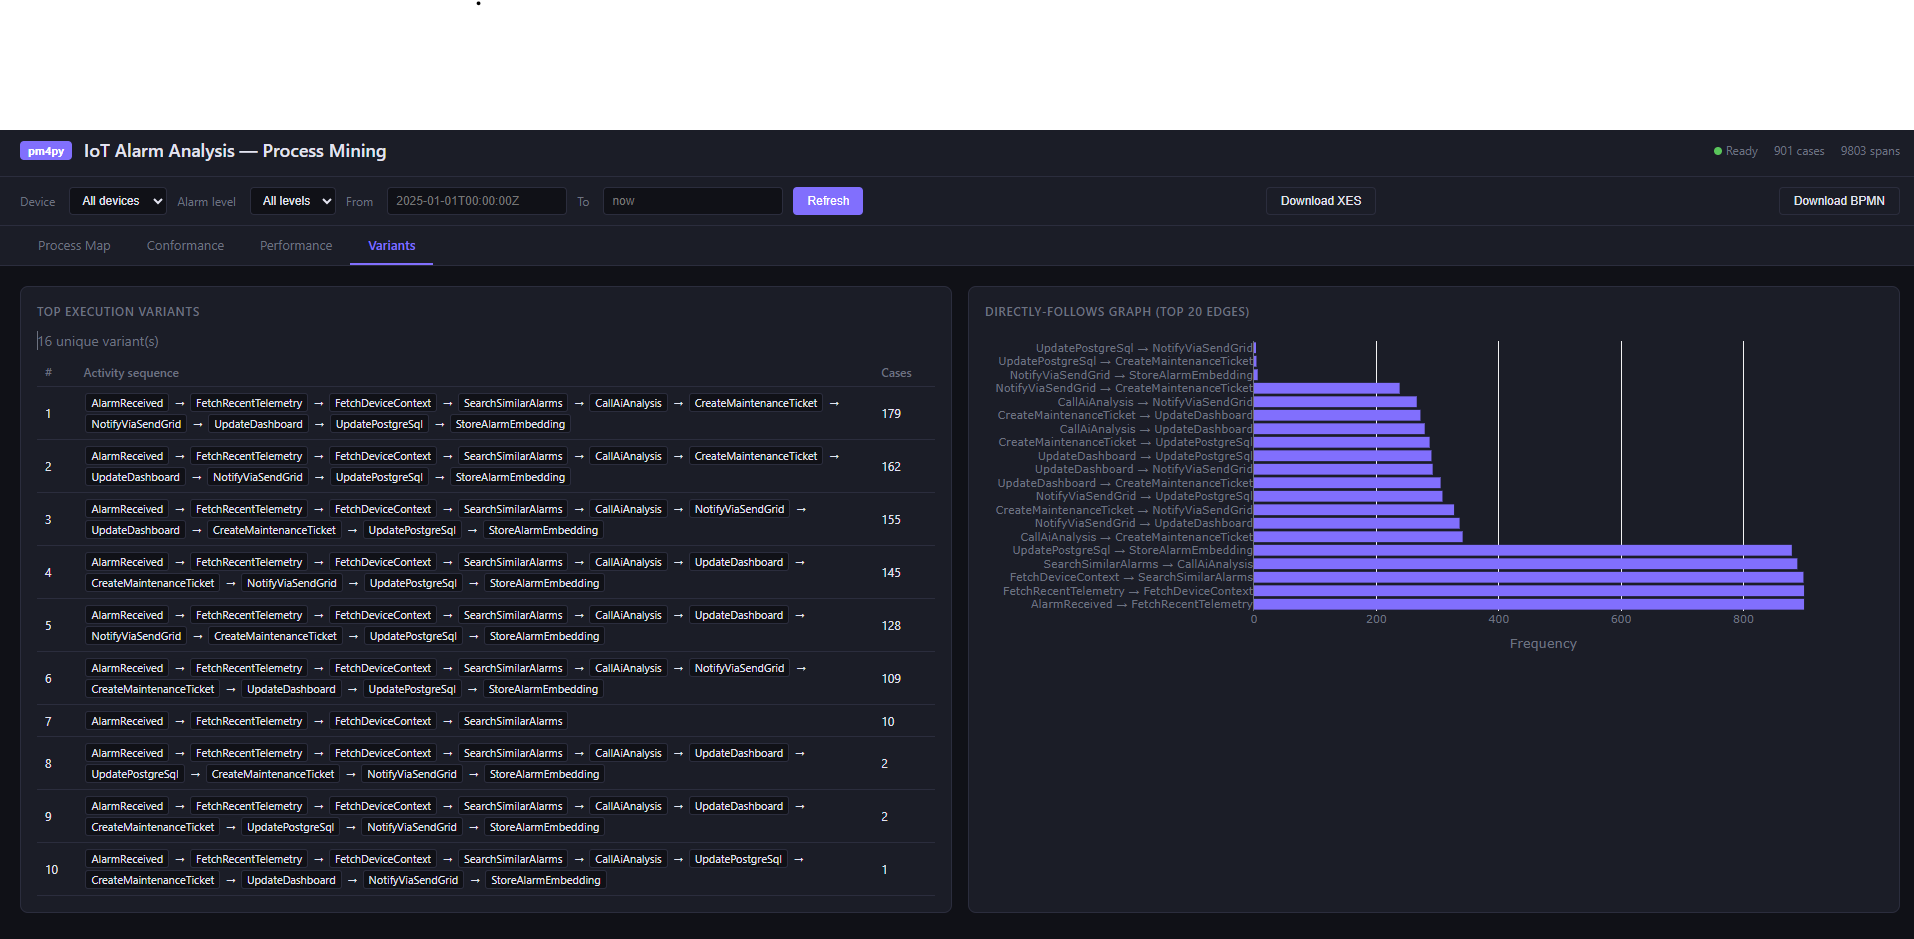
Variant analysis. Variants are unique execution sequences. In a deterministic workflow you might expect one or two. In practice, error handling, fallback paths, and partial failures produce more. The variant table shows which paths are common and which are rare — and the Directly-Follows Graph shows transition frequencies between activities.
The dashboard
The single-page app at /dashboard renders all of this with Plotly.js:
- A Petri net SVG (process map)
- A fitness gauge with per-case conformance table
- Sojourn time bar charts and throughput histograms
- Variant frequency table and DFG
Filters for device ID, alarm level, and time range apply across all views. The event log can be exported as XES (importable into ProM or Disco) or BPMN 2.0.
Running locally with Aspire
The entire stack — PostgreSQL with pgvector, Service Bus emulator, MQTT broker, Durable Task Service, Grafana, and the Python process mining service — starts with a single dotnet run from the AppHost. The process mining data directory is bind-mounted so traces survive service restarts during development.
In my previous post on the IoT alarm pipeline, I covered how Aspire makes local infrastructure as simple as production. The process mining service fits into that pattern exactly: registered as a container resource, discovered by name, no manual wiring.
Takeaways
Distributed systems are hard to reason about precisely because the interesting behavior is not in any single service — it is in the interactions. An alarm analysis run touches a Function host, a PostgreSQL database, a pgvector index, an Azure OpenAI endpoint, and a Service Bus queue, all within a few seconds. Logs tell you what each service did. Metrics tell you how often and how fast. Neither tells you whether the sequence of interactions across those services was the intended one, whether steps were skipped under load, or which coordination path dominates when the AI is unavailable. Process mining answers those questions directly.
The process model is the ground truth of runtime behavior. A BPMN diagram in Confluence documents intent. The Petri net discovered from actual traces documents reality. The gap between them — visible in conformance fitness scores — is exactly what you want to find before a customer does. In a Durable Functions workflow this is especially useful: replays, retries, and fan-out mean the execution graph is richer than the code suggests, and discovery makes that visible.
Variant analysis exposes implicit branches. In a complex orchestration you might define one happy path and a handful of error handlers. Under production conditions, the actual variant count is usually higher — timeouts produce partial executions, retries duplicate steps, test traffic follows abbreviated paths. The variant table surfaces each distinct execution sequence with its frequency, so you can distinguish a genuine error path from noise and prioritize accordingly.
Performance analysis localizes bottlenecks without aggregation bias. A dashboard that shows average latency for CallAiAnalysis at 2,100 ms is useful. What it hides is whether that average is stable or whether 90% of calls finish in 800 ms and 10% take 12 seconds — and whether those slow cases correlate with a specific device, alarm level, or time of day. Process mining keeps timing data per-case, so slow paths through the graph are visible as slow paths, not diluted into a system-wide average.
Instrumentation you already have is enough. The spans you already emit for observability carry everything process mining needs. The case ID — orchestration instance ID here, correlation ID elsewhere — is the one addition that turns a trace into a case in an event log. Get that right and discovery, conformance, and performance analysis follow from instrumentation you would have written anyway.